using GeoExplorer, GeoJSON, GLMakie, Extents
fig = Figure(size=(800, 600))
app = explore(extent=Extents.Extent(X=(-105.30, -105.24), Y=(39.98, 40.03)), figure=fig)
# Add a polygon layer
polygon = GeoJSON.read("""
{
"type": "Polygon",
"coordinates": [[
[-105.29, 40.02],
[-105.27, 40.02],
[-105.27, 40.00],
[-105.29, 40.00],
[-105.29, 40.02]
]]
}
""")
plt1 = plot_geometry!(app, polygon; color=(:dodgerblue, 0.3), strokecolor=:dodgerblue, strokewidth=2)
add_layer!(app, "Zone A", plt1)
# Add a scatter layer
points = GeoJSON.read("""
{
"type": "MultiPoint",
"coordinates": [
[-105.275, 40.015],
[-105.265, 40.005],
[-105.255, 40.020],
[-105.285, 40.010],
[-105.260, 40.012]
]
}
""")
plt2 = plot_geometry!(app, points; color=:red, markersize=12)
add_layer!(app, "Stations", plt2)
# Add a line layer
route = GeoJSON.read("""
{
"type": "LineString",
"coordinates": [
[-105.29, 39.99],
[-105.27, 40.01],
[-105.25, 40.005],
[-105.24, 40.02]
]
}
""")
plt3 = plot_geometry!(app, route; color=:green, linewidth=3)
add_layer!(app, "Route", plt3)
wait(app.map)
save("layers_example.png", fig)Layer Management
Layers let you manage multiple data overlays on the map. Each layer wraps a Makie plot object with a name and visibility toggle, and integrates with the built-in layers panel (☰) in the UI.
Adding Layers
Use plot_geometry! or any Makie plotting function on app.map_axis, then register it as a layer with add_layer!:
using GeoExplorer, GeoJSON, GLMakie

app = explore()

# Plot data and register as a layer
geom = GeoJSON.read("boundaries.geojson")
plt = plot_geometry!(app, geom)
add_layer!(app, "Boundaries", plt)

# Or use Makie directly (coordinates in Web Mercator)
scatter_plt = scatter!(app.map_axis, xs, ys; color=:red, markersize=8)
add_layer!(app, "My Points", scatter_plt)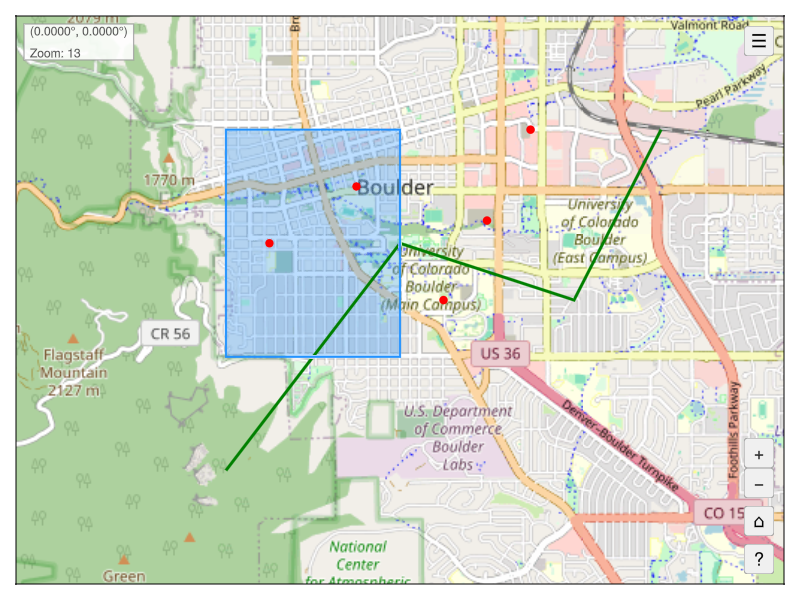
The Layers Panel
Click the ☰ button in the top-right corner to open the layers panel. From there you can:
- Toggle visibility with the checkbox next to each layer name
- Zoom to a layer’s extent with the zoom button (⌖)
Programmatic Layer Control
# Toggle visibility on/off
toggle_layer!(app, "Stations")

# Get a layer by name
layer = get_layer(app, "Stations")
layer.visible[]  # true or false

# Zoom the map to fit a layer's extent
zoom_to_layer!(app, "Zone A")
zoom_to_layer!(app, "Zone A", padding=0.2)  # 20% padding

# Remove a layer (deletes the plot from the map)
remove_layer!(app, "Route")
The Layer Struct
| Field | Type | Description |
|---|---|---|
name |
String |
Display name shown in the layers panel |
plot |
Any |
Reference to the Makie plot object |
visible |
Observable{Bool} |
Reactive visibility state |
Layer Functions
| Function | Description |
|---|---|
add_layer!(app, name, plot) |
Register a plot as a named layer |
remove_layer!(app, name) |
Remove a layer and delete its plot |
toggle_layer!(app, name) |
Toggle a layer’s visibility |
get_layer(app, name) |
Get a Layer by name (or nothing) |
zoom_to_layer!(app, name; padding=0.1) |
Zoom the map to fit a layer’s extent |