Code
using Pkg
Pkg.activate(joinpath(@__DIR__, ".."))

using MarshallWildfire
using GLMakie

output_dir = joinpath(@__DIR__, "images")
mkpath(output_dir)"/home/runner/work/MarshallWildfire.jl/MarshallWildfire.jl/report/images"This page visualizes fire spread rates for each of the Anderson 13 fuel models. Each contour plot shows how spread rate varies with wind speed (0-60 mph) and terrain slope (0-45 degrees) under head fire conditions with 10% fuel moisture.
using Pkg
Pkg.activate(joinpath(@__DIR__, ".."))
using MarshallWildfire
using GLMakie
output_dir = joinpath(@__DIR__, "images")
mkpath(output_dir)"/home/runner/work/MarshallWildfire.jl/MarshallWildfire.jl/report/images"Fast-spreading fuels dominated by grasses. These fuels typically have the highest spread rates due to their fine structure and low moisture content.
path = joinpath(output_dir, "fuel_model_1.png")
if !isfile(path)
    fuel = MarshallWildfire.FUEL_MODELS[1]
    fig = MarshallWildfire.plot(fuel)
    save(path, fig)
end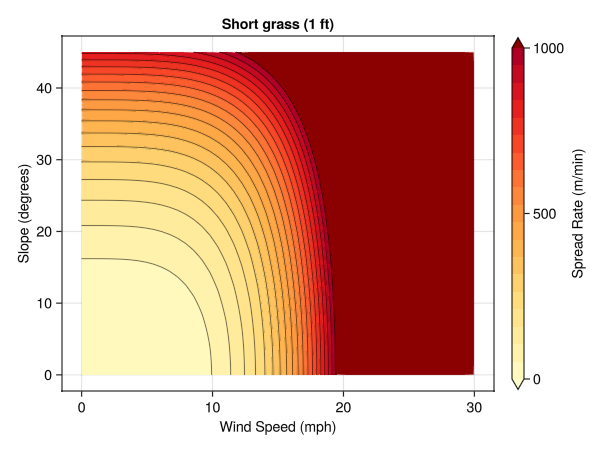
path = joinpath(output_dir, "fuel_model_2.png")
if !isfile(path)
    fuel = MarshallWildfire.FUEL_MODELS[2]
    fig = MarshallWildfire.plot(fuel)
    save(path, fig)
end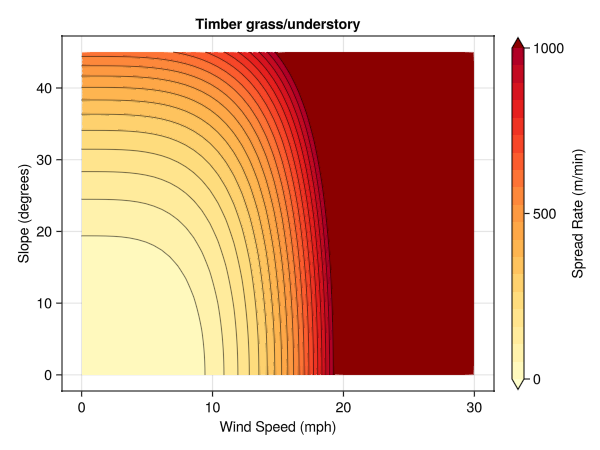
path = joinpath(output_dir, "fuel_model_3.png")
if !isfile(path)
    fuel = MarshallWildfire.FUEL_MODELS[3]
    fig = MarshallWildfire.plot(fuel)
    save(path, fig)
end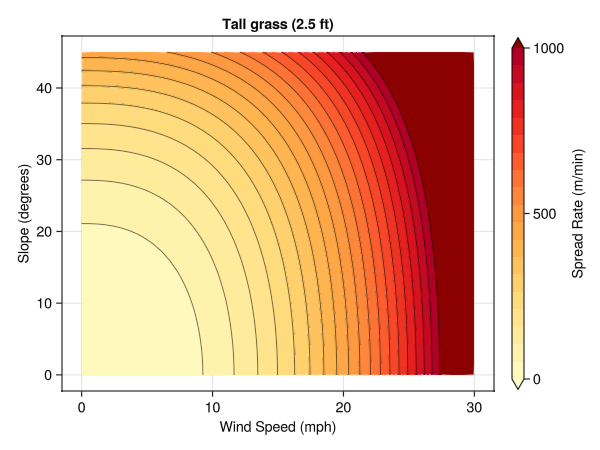
Brush and chaparral fuels. Model 4 (chaparral) produces some of the most extreme fire behavior.
path = joinpath(output_dir, "fuel_model_4.png")
if !isfile(path)
    fuel = MarshallWildfire.FUEL_MODELS[4]
    fig = MarshallWildfire.plot(fuel)
    save(path, fig)
end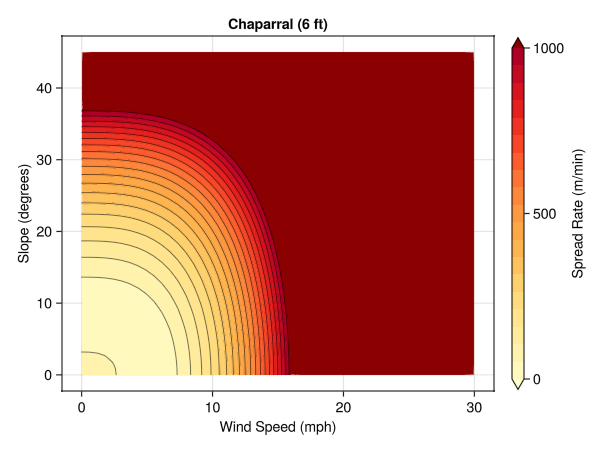
path = joinpath(output_dir, "fuel_model_5.png")
if !isfile(path)
    fuel = MarshallWildfire.FUEL_MODELS[5]
    fig = MarshallWildfire.plot(fuel)
    save(path, fig)
end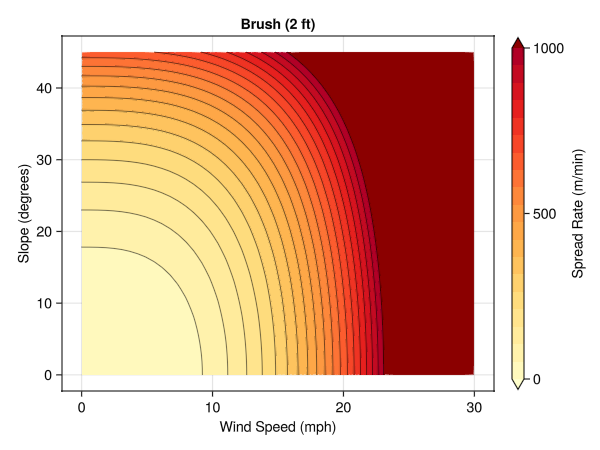
path = joinpath(output_dir, "fuel_model_6.png")
if !isfile(path)
    fuel = MarshallWildfire.FUEL_MODELS[6]
    fig = MarshallWildfire.plot(fuel)
    save(path, fig)
end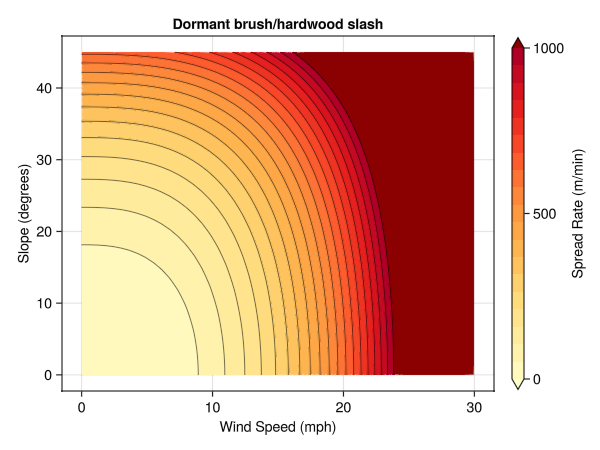
path = joinpath(output_dir, "fuel_model_7.png")
if !isfile(path)
    fuel = MarshallWildfire.FUEL_MODELS[7]
    fig = MarshallWildfire.plot(fuel)
    save(path, fig)
end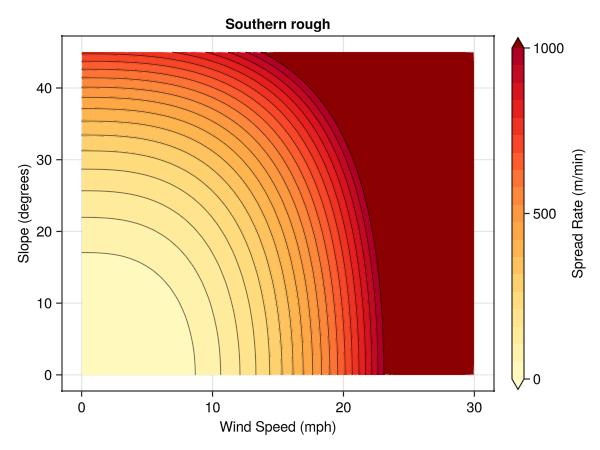
Compact forest floor fuels. Generally slower spreading due to compact fuel beds.
path = joinpath(output_dir, "fuel_model_8.png")
if !isfile(path)
    fuel = MarshallWildfire.FUEL_MODELS[8]
    fig = MarshallWildfire.plot(fuel)
    save(path, fig)
end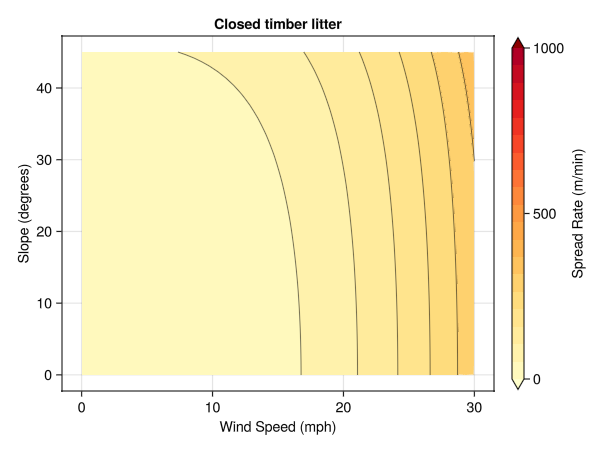
path = joinpath(output_dir, "fuel_model_9.png")
if !isfile(path)
    fuel = MarshallWildfire.FUEL_MODELS[9]
    fig = MarshallWildfire.plot(fuel)
    save(path, fig)
end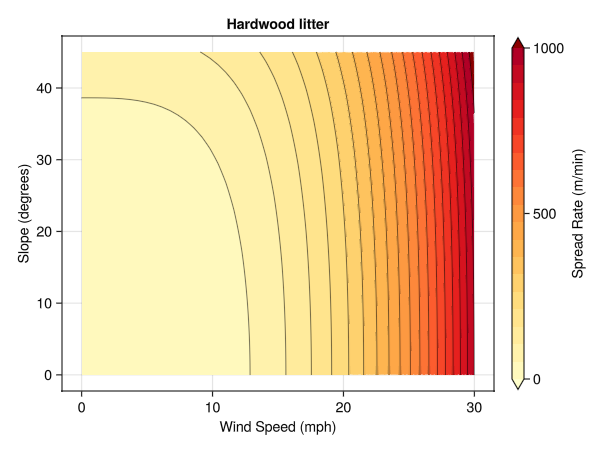
path = joinpath(output_dir, "fuel_model_10.png")
if !isfile(path)
    fuel = MarshallWildfire.FUEL_MODELS[10]
    fig = MarshallWildfire.plot(fuel)
    save(path, fig)
end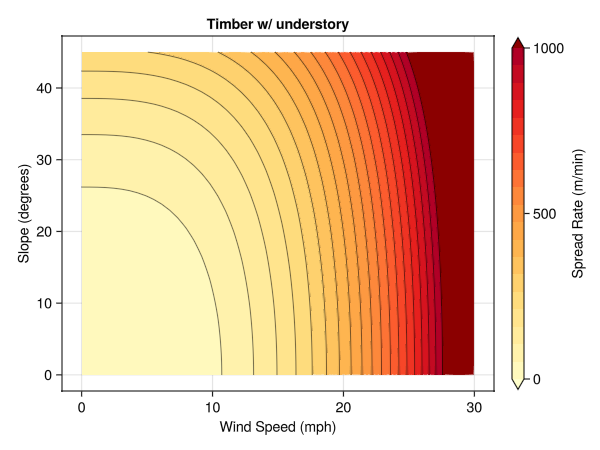
Logging debris and slash fuels. Can produce intense fires with high fuel loads.
path = joinpath(output_dir, "fuel_model_11.png")
if !isfile(path)
    fuel = MarshallWildfire.FUEL_MODELS[11]
    fig = MarshallWildfire.plot(fuel)
    save(path, fig)
end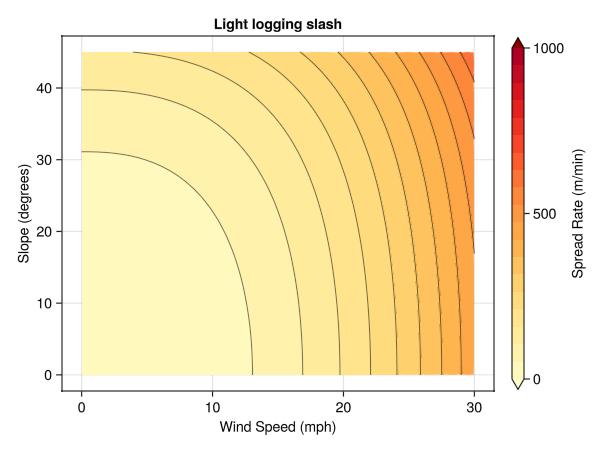
path = joinpath(output_dir, "fuel_model_12.png")
if !isfile(path)
    fuel = MarshallWildfire.FUEL_MODELS[12]
    fig = MarshallWildfire.plot(fuel)
    save(path, fig)
end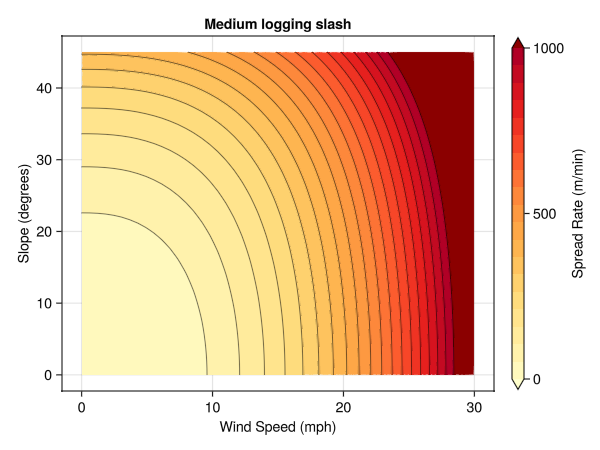
path = joinpath(output_dir, "fuel_model_13.png")
if !isfile(path)
    fuel = MarshallWildfire.FUEL_MODELS[13]
    fig = MarshallWildfire.plot(fuel)
    save(path, fig)
end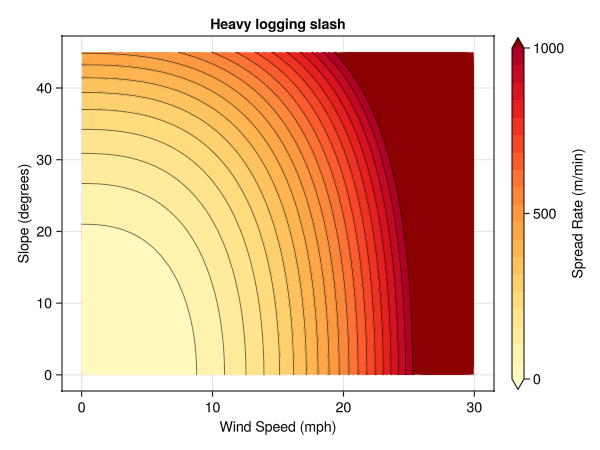
The following table summarizes the key properties of each Anderson 13 fuel model:
| Model | Name | Fuel Load (kg/m²) | SAV Ratio (1/m) | Mx (%) | Depth (m) |
|---|---|---|---|---|---|
| 1 | Short grass | 0.166 | 11,483 | 12 | 0.305 |
| 2 | Timber grass/understory | 0.896 | 9,843 | 15 | 0.305 |
| 3 | Tall grass | 1.345 | 4,921 | 25 | 0.762 |
| 4 | Chaparral | 2.242 | 6,562 | 20 | 1.829 |
| 5 | Brush | 0.448 | 6,562 | 20 | 0.610 |
| 6 | Dormant brush | 0.673 | 5,741 | 25 | 0.762 |
| 7 | Southern rough | 0.507 | 5,741 | 40 | 0.762 |
| 8 | Closed timber litter | 0.673 | 6,562 | 30 | 0.061 |
| 9 | Hardwood litter | 1.307 | 8,203 | 25 | 0.061 |
| 10 | Timber w/ understory | 1.345 | 6,562 | 25 | 0.305 |
| 11 | Light logging slash | 0.673 | 4,921 | 15 | 0.305 |
| 12 | Medium logging slash | 1.794 | 4,921 | 20 | 0.701 |
| 13 | Heavy logging slash | 3.140 | 4,921 | 25 | 0.914 |
Source: Anderson, H. E. (1982). Aids to Determining Fuel Models for Estimating Fire Behavior. USDA Forest Service General Technical Report INT-122. Values converted to SI units.
Key: - Fuel Load (w₀): Total dry weight of fuel per unit area - SAV Ratio (σ): Surface-area-to-volume ratio - higher values indicate finer fuels that ignite more easily - Mx: Dead fuel moisture of extinction - fires won’t spread if fuel moisture exceeds this value - Depth (δ): Fuel bed depth
Fuel moisture content is critical for fire behavior. The moisture of extinction (Mx) defines the threshold above which fire will not spread. The plots above assume 10% fuel moisture, representing dry conditions.
100-hour dead fuel moisture refers to the moisture content of dead woody fuels with diameters between 1-3 inches (2.5-7.6 cm), such as branches and small logs. The “100-hour” designation indicates the timelag—approximately how long (in hours) it takes for these fuels to reach equilibrium with atmospheric moisture conditions. Larger fuels respond more slowly to weather changes, while finer fuels (1-hour, 10-hour) respond more quickly.
The map below shows 100-hour dead fuel moisture from gridMET on December 30, 2021 (the day of the Marshall Fire). Lower values indicate drier, more flammable conditions.
path = joinpath(output_dir, "fuel_moisture.png")
if !isfile(path)
    @info "Generating fuel_moisture.png"
    MarshallWildfire.plot_fuel_moisture(; output_dir)
else
    @info "fuel_moisture.png already exists"
end;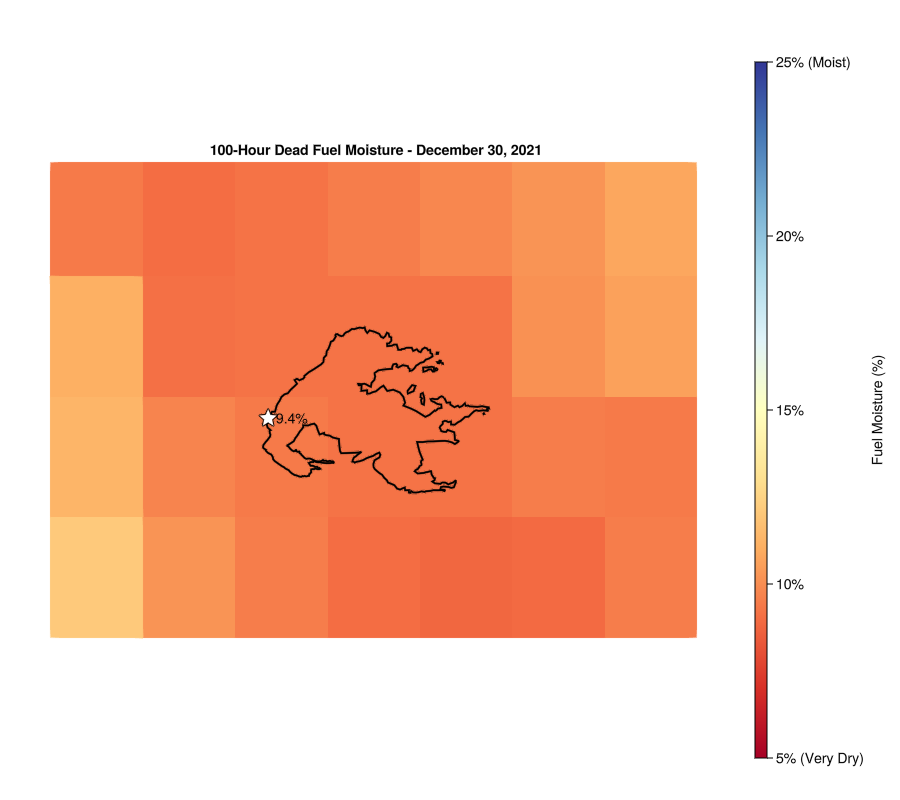
The exceptionally low fuel moisture values on December 30, 2021 contributed to the rapid spread of the Marshall Fire.